


Introduction
Ever since it became more than an atmospheric mass of condensed water vapor, cloud has provided apps the ability to automatically scale with it and significantly impact its use. Cloud enables teams to operate applications without having to constantly and manually modify the underlying resources to fit the actual demand.
It also provides cost-effectiveness, because you don’t have to oversize architectures in order to serve occasionally occurring, extraordinarily high use. Or does it?
Indeed, if you happen to let go of the reins, your cloud provider could consume a lot more than they should, or than they can, in order for them to run the apps on it.
It’s worth checking from time to time what kind of processes you have set up and how they consume your resources, because automated scaling can allocate unnecessary resources, or there could be unnecessary stuff running on them.
We did an investigation, for example, at one of our biggest customers, a multi-billion euro chemical giant running Kubermatic Kubernetes Platform (KKP), to find out if the resource allocation for various pods was legitimate.
Pod Resource Requests Versus Actual Usage
The main concern that initiated this investigation was that it seemed like we were provisioning more worker node machines in Microsoft Azure seeding without them being used a lot by the user clusters. We wanted to find out what caused this gap.
The basic method of scaling works with the help of a service called cluster-autoscaler, which is responsible for scaling up the nodes and the pods. Fundamentally, appropriate resource requests (when more memory or CPU is needed) should precede starting up any pending pods, and pods remain pending when they can’t get the requested resources they need to get set up and to run.
Autoscaler automatically creates new nodes if the sum of the pod resource requests is higher than the existing resources. The problem occurs when these requests are much higher than the actual usage. Then unnecessary nodes start to run and this automatically increases the cost of the cloud service.
Investigating Legitimate Usage of Resource Types
Key points to investigate:
- Check if memory usage is in line with memory requests
- Check if CPU usage is in line with CPU requests
- Check on volumes utilization
- Double check VM types being used and which others are available
When comparing usage versus requests it’s important to determine how we quantify usage, because it is not a constant value like request is. It has peaks and valleys, so you definitely don’t want to make any architectural changes based on current values. During this investigation we used the resource usage for all types based on an average value over 7 days.
Check if Memory Usage Is in Line With Memory Requests
First of all, we laid down constraints where the proportion of requests versus usage could be considered as healthy. In this case, greater than 512 MB of requests by the pods and less than 25% of usage.

As we can see, the memory requests are pretty much in line with the actual usage, which seems quite healthy.
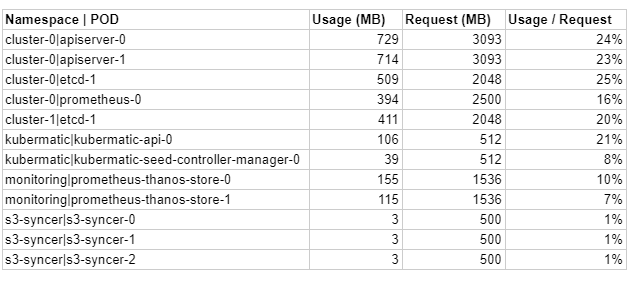
In order to achieve smart optimization, it’s also crucial to know what particular pods are responsible for. For instance, the namespace s3-syncer contains cron jobs which only run for a certain period of time, so we shouldn’t include them for optimization.
As memory requests seemed to be in line with utilization, we didn’t change any of them at this point. If you are in a different situation, where this isn’t the case, you’ll need to fine-tune memory usage (about fine-tuning memory).
Check if CPU Usage Is in Line With CPU Requests
We also laid down constraints where the proportion of requests versus usage could be considered as healthy for this area. In this case it was greater than 250 millicores of requests by the pods and less than 50% of usage. So we looked for higher CPU allocations with relatively low utilization.

You don’t have to be a rocket scientist to see that there’s a large gap between CPU requests and the actual CPU usage. The overflow is almost 3 times. We definitely have to dig deeper and analyze the pods’ CPU requests.
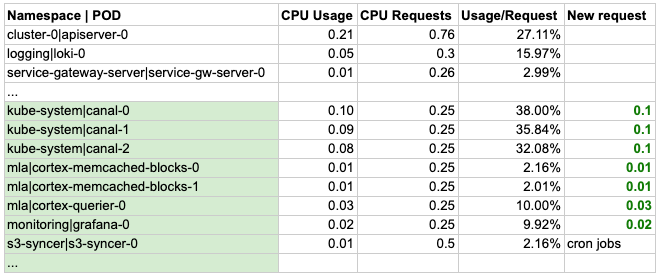
This table is a dummy version of the original, because it consisted of many pods, so in order to demonstrate and focus on the method specifically, we made it simpler.
In our case, the pods highlighted in green had the potential of decreasing (setting CPU requests) their invalid amount of CPU requests.
Canal runs as DaemonSet, so it presents on all nodes necessary for networking. However, we can reduce its CPU core request, which will release 150 millicores of CPU on each machine.
Most of the MLA and monitoring pods are also significantly over-requested, so by setting their requests lower we can release 240 millicores on average.
In our case we were able to save roughly 5 cores, which is equal to completely freeing up a whole machine.
Check on Volumes Utilization
Storage and claimed PersistentVolume usage was checked and the cluster was using 57 out of 64 possible volumes in 8 nodes. This should be considered as high volume usage and it’s beneficial to investigate further.
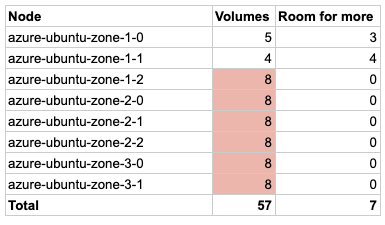
We have reached the maximum number of volumes that can be attached to a node in 6 out of 8 machines. Let’s check the number of volumes used by each namespace:
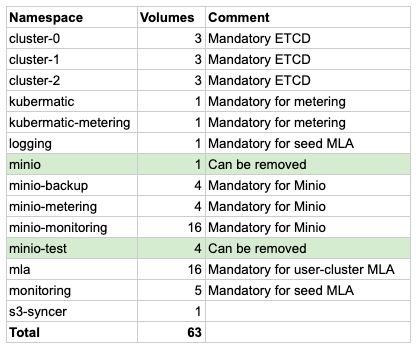
The volumes highlighted in green used by MinIO namespaces can be removed, because they were used for testing. Here it’s important to note again that you have to know what you can get rid of without negative impact on the services. So in this case we were able to free up a total of 5 volumes.
When MinIO needs growth, it will need 4 volumes per increase. Every new user-cluster requires 3 volumes. This means that volumes will be driving up the VM count relatively quickly. These VMs don’t have enough storage capacity to serve the cluster and will reach the limit prematurely.
Double Check VM Types We Use and Others That Are Available
Let’s look into the VM types we use in Azure and also consider a more comprehensive one for our architecture. It’s been mentioned that VMs with more storage capacity would be more satisfactory. Let’s compare the current VM type with another in Azure:
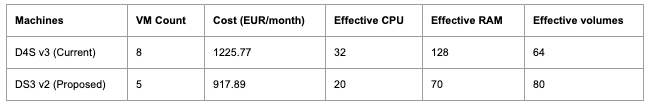
DS3 VM nodes come with the same amount of CPU as the currently used D4S. However, since we are about to optimize the CPU usage and decrease it dramatically, we’ll probably be good to go with 5 or even 4 nodes. The amount of memory also decreases with fewer nodes, but we are only utilizing 50-60% of our current memory capacity, so the decreased amount of memory will be quite enough for the cluster.
The advantage of DS3 machines is that they have more storage capacity (almost double per node), and even with fewer than 5 nodes, we’ll have a higher amount of volumes attached to our cluster. So it seems that DS3 is a much more efficient choice for our cluster in terms of CPU, memory and volume.
The key takeaway here is to choose your machines with the provided resources that are best suited to your architecture. And optimizing resource consumption is more important than choosing the right machines, because non-optimized consumption could lead you to selecting the wrong type of VMs. As shown, after optimization we were able to reduce our cloud expenses by 25%, so optimizing your VM setup is definitely worth doing.
Some Useful Links to Learn More
- Finding the most suitable VM type in Azure
- Read more about KKP Cluster Scaler
- Learn more about external cluster management and other highlights in KKP 2.19
Next Steps
So, now we have an action plan to make our cluster more efficient! However, all of these changes, even changing the machine deployment, should be applied in a sandbox first. Then we want to verify that these changes yield the desired increased efficiency and lower the unnecessary consumption of resources, without causing any instability in the workloads.
If the planned changes appear to be working in reality, we can start leveraging the new setup in production!
Contact us for cloud optimization here.

