


As your Kubernetes installation grows in size, the day 2 operations of your clusters can quickly become a complex and sophisticated endeavour. When designing and developing Kubermatic Kubernetes Platform (KKP) as a multi-cloud and multi-cluster platform, we encountered a lot of challenges that required new strategies to make the operational tasks easier and more efficient.
In this post, we’ll look at how we implemented a Monitoring, Logging, and Alerting stack (MLA) for a highly distributed platform, in a scalable and efficient manner.
To begin, let’s take a look at a typical MLA stack in a Kubernetes cluster:
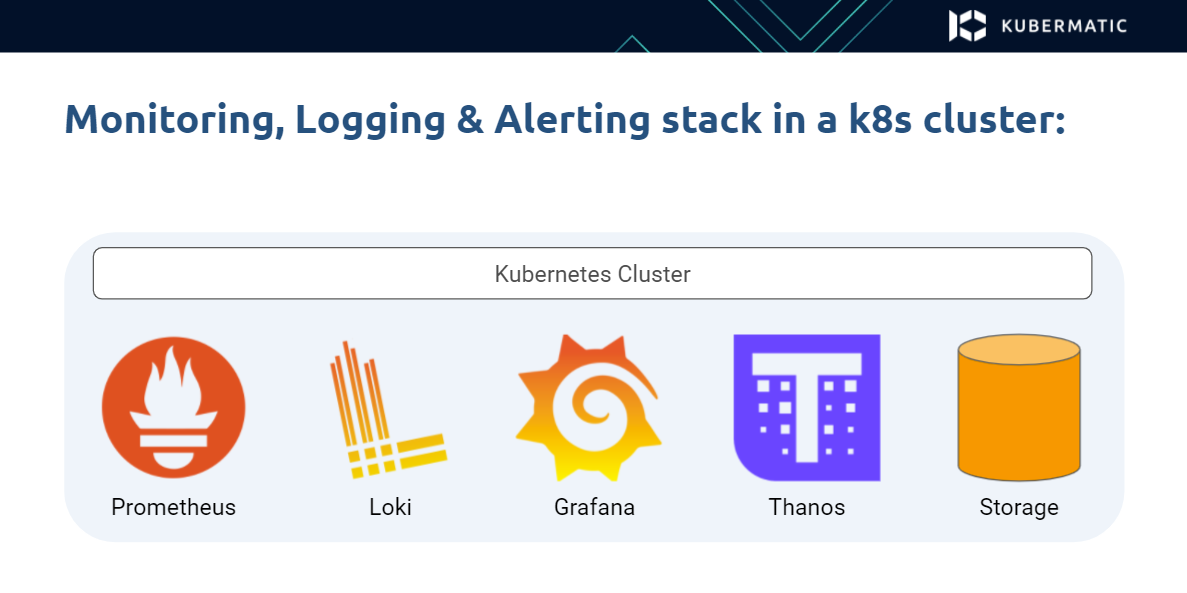
Several different components may be deployed in a Kubernetes cluster, such as
- Prometheus for scraping the application metrics
- Loki for the application logs
- Grafana for providing the user interface to access the logs and metrics, and the dashboards generated from them
- Thanos and some cluster storage to provide long term storage of metrics and logs
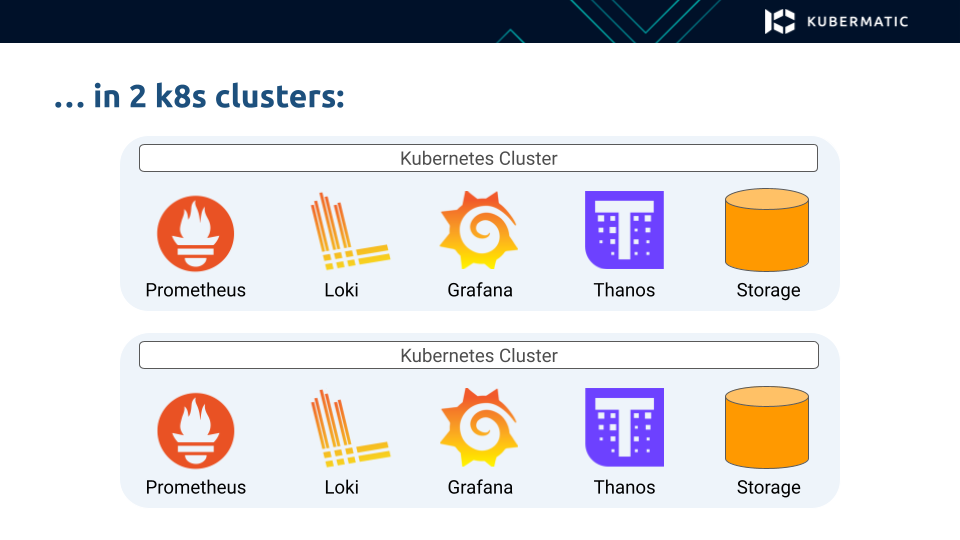
When you have more than one Kubernetes cluster, this process is usually repeated, with all of these components running in each cluster.
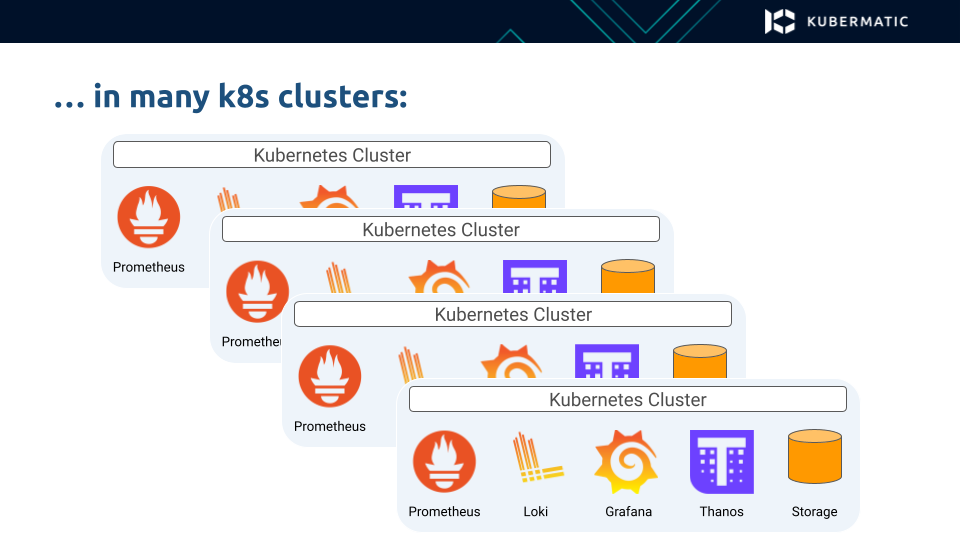
So far, so good. But when you start adding more clusters, it can quickly turn into an operational nightmare that is hard to manage. Installing and setting up the same components and version upgrades required across a lot of clusters is time consuming and inefficient.
How do we make this easier? This was precisely the question we had to answer when building our Kubermatic Kubernetes Platform. And this is what we came up with.
Since KKP has a hierarchical architecture, in which the control plane components from multiple users run in a single seed cluster, we can build the MLA stack on top of this hierarchy.
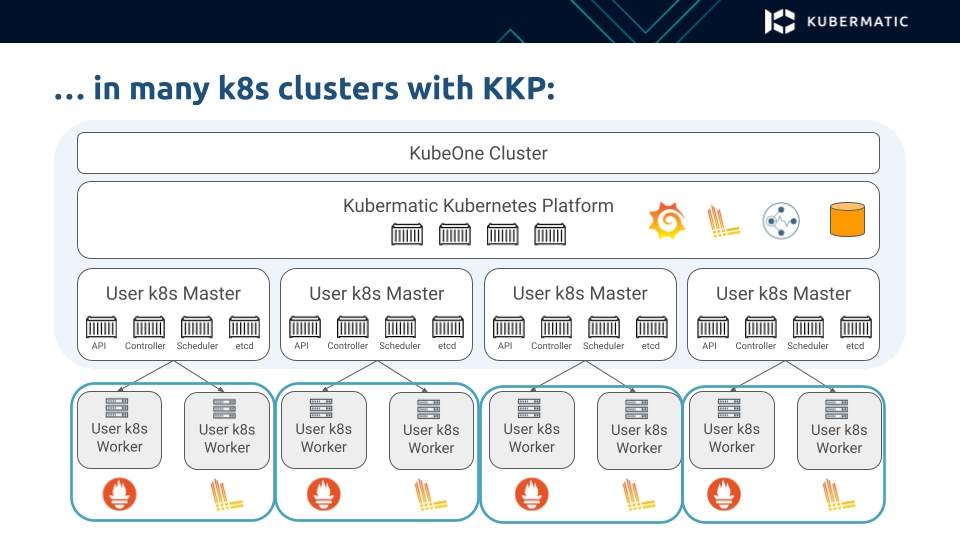
So, in the user clusters we just deploy the stateless components that stream the container metrics and logs to the seed cluster.
In the seed cluster, we then deploy all the complex components responsible for long-term storage and user interface, respecting multi-tenancy, so that every user can only access data in the cluster they have access.
But what if we are talking about an even more distributed environment with multiple seed clusters located at different locations?
In that case, we use a similar approach: the user clusters only contain the exporter applications and the seed clusters store all of the data.
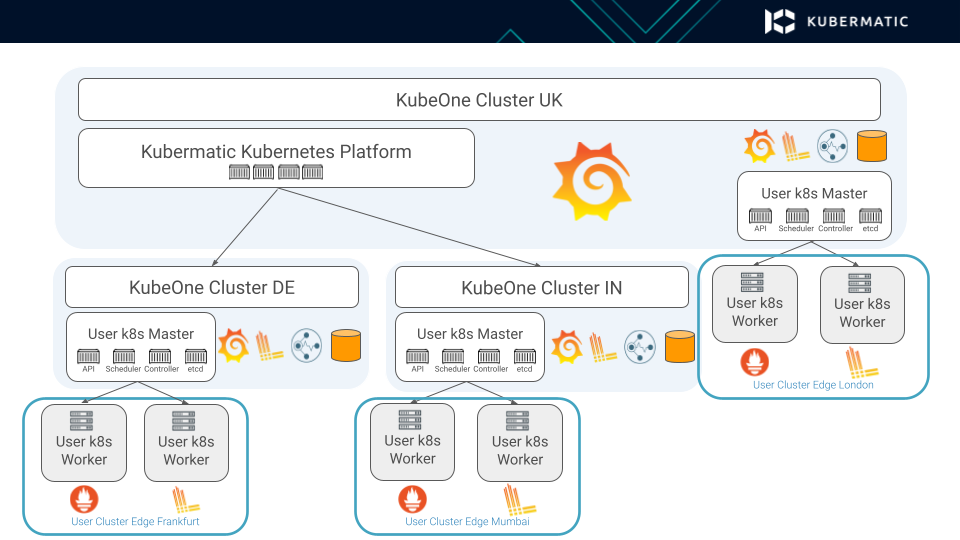
The data is still situated close to the user clusters, since we don’t want to stream all of that data across other locations. At the same time, we are still able to provide a single Grafana user interface that allows us to access the logs and metrics across all of the clusters and effectively streamline the entire hierarchy.
Implementing our MLA stack for KKP in line with this approach brought us several benefits:
Easy installation in user clusters with a single click or an API flag, or can also be installed by default, into every cluster
Easy day 2 operations and upgrades of components in user clusters, because they are tiny and stateless
Low footprint for user clusters; particularly important for edge use cases running worker nodes on resource-constraint nodes
Single pane of glass for thousands of clusters, to access all logs and metrics across all clusters
Multi-tenancy support:
Authentication and authorization is integrated with KKP users, projects and roles
Per-tenant Grafana view for logs and metrics
Or:
Global admin Grafana view for logs, metrics and alerts
If you like to play around with Kubermatic Kubernetes Platform to manage your distributed Kubernetes clusters, check out our documentation to get you started. Also, feel free to be in touch via Github.
Learn More
- Read our blog post: The Complete Guide to Kubernetes Metrics
- Video: How to Write Software That Sets up Kubernetes Anywhere


